Enhanced communication has long been championed as a benefit of online learning environments, and many educational technology strategies will include statements around increased communication and collaboration between peers. So in thinking towards an engagement metric for my current project and the need to get inside activities for my, in progress, PhD proposal exploring forum use is one of the more interesting analytics spaces within the LMS. I’ve used three techniques for my initial analysis: (1) a look at post and reply counts inspired by @phillipdawson and his work on the Moodle engagement block, (2) social network analysis inspired by a paper by @shaned07 on teacher support networks; and (3) sentiment and political view analysis provided by @indicoData as an introduction to text mining.
I’ll start with sharing the visualisations and where these might be useful and then finish with details of how I coded these.
Forum posts

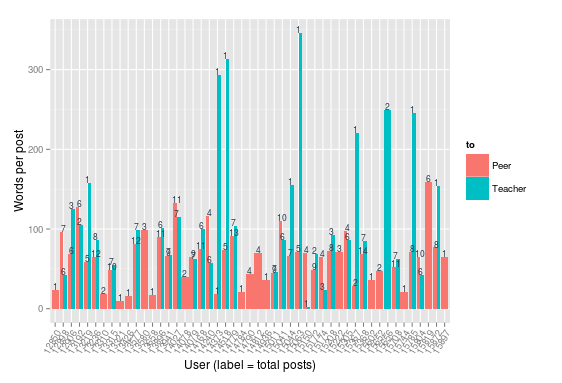
Following Phillip Dawson’s work on the engagement block for Moodle, I decided to look into two posting patterns: (1) posts over time; and (2) average post word count. The over time analysis (above) compares the weekly posting pattern of each student in a group. For most students replies to peers and teachers are “in phase” suggesting that when they are active they discuss with the entire group and so learning design might focus on keeping them active. One can also notice that those who only reply to peers appear to have much lower overall post activity, which in the original engagement block would place them at-risk – learning design may consider teacher-led interventions to understand whether discussions with the teacher impact their overall activity. The average word count analysis (below) reinforces the latter case where those demonstrating that those who only reply to peers infrequently post shorter replies. Conversely those who post infrequent lengthy posts tend to target the teacher and do not follow up with many further replies discussion. There is some suggestion of an optimal word count around 75-125 for forum posts that might warrant further investigation.
Social Network Analysis
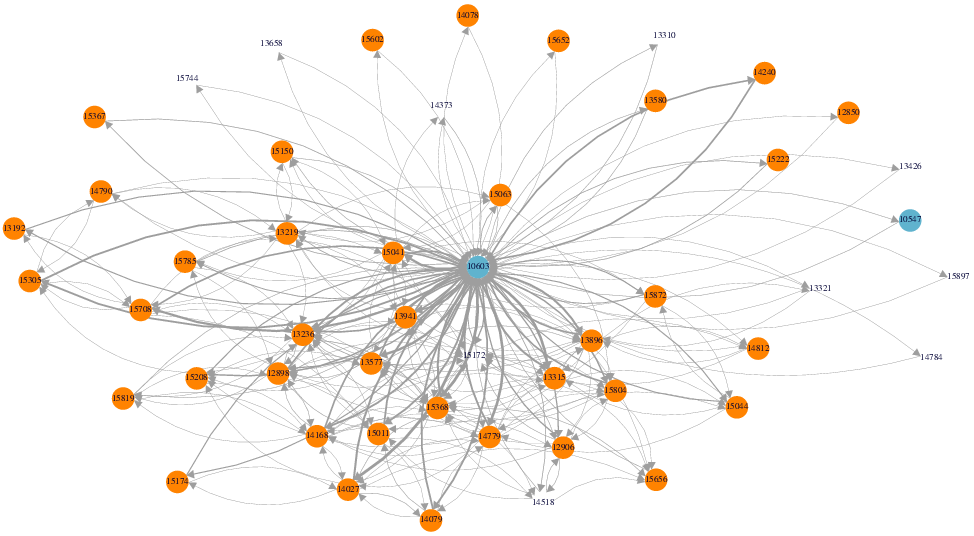
The network diagram (above) confirms what was emerging in the post analysis: that a smaller core of students (yellow circles) are responsible for a majority of the posts, and further reveals the absolute centrality of the teacher (blue circle) that highlight how important teacher-led interventions may be to this group. This is probably not surprising although the the teacher may use this to consider how they might respond more equally to the group – here the number of replies is represented by increasing thickness of the grey edges and they appear to favour conversations in the lower left of the network. A similar theme is explored by Shane Dawson (2010) in “‘Seeing’ the learning community”. One can understand this further by plotting eigenvalue centrality against betweenness centrality (below) where a student with high betweenness and low eigenvalue centrality may be an important gatekeeper to a central actor, while a student with low betweenness and high eigenvalue centrality may have unique access to central actors.

Content Analysis
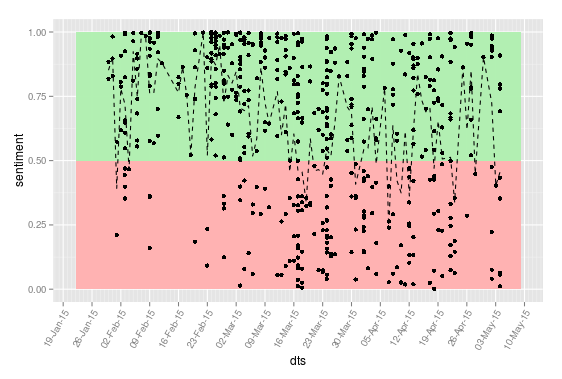
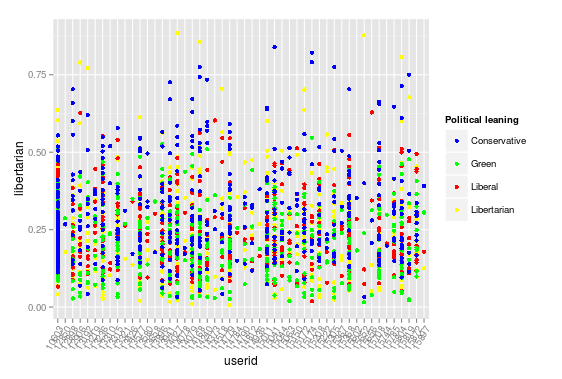
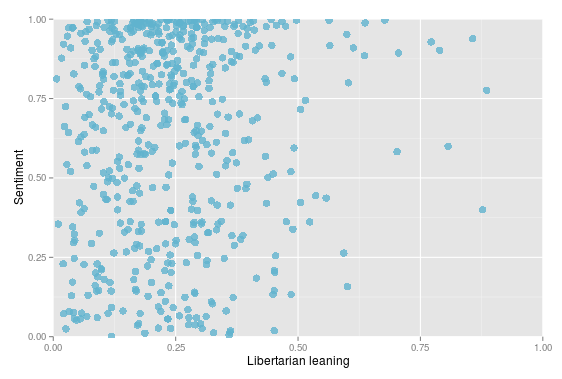
Text analysis of forums provides a necessary complement to the above analysis, exploring the content within the context. I have used the Indico API to aid my learning of this part of the field rather than try to build this from scratch. The sentiment analysis API determines whether a piece of text was positive or negative in tone and rates this on a scale from 0 (negative) to 1 (positive). Plotting this over time (above) provides insights into how different topics might have been received with this group showing generally positive participation, although with two noticeable troughs that might be worth some further exploration. The political opinion API scores political leaning within a text on a scale of 0 (neutral) to 1 (strong). Plotting this for each user (below) shows that more politicised posts tend to be conservative (unsurprising) although there is a reasonable mix of views across the discussion. What might be interesting here is how different student respond to different points of view and whether a largely conservative discussion, for example, might discourage contribution from others. Plotting sentiment against libertarian leaning (below2) shows that participants are, at least, very positive when leaning towards libertarian ideology, though this is not the only source of positivity. Exploring text analysis is fascinating and if projects such as Cognitive Presence Coding and the Quantitative Discourse Analysis Package make this more accessible then there are some potentially powerful insights to be had here. I had also hoped to analyse the number of external links embedded in posts following a talk by Gardner Campbell I heard some years ago about making external connections of knowledge, however the dataset I had yielded zero links, which while informative to learning design is not well represented in a visual (code is included below).
How to guide
The following shares the code used to produce the above visualisations and should work with any Moodle version.
Step 1: Data Extraction
This requires some new data sets from the Moodle database query in the initial log analysis.
Group members
SELECT ue.userid, e.courseid, g.id AS groupid, r.shortname AS role, gm.timeadded
FROM mdl_groups_members gm
JOIN mdl_groups g ON gm.groupid = g.id
JOIN mdl_user_enrolments ue ON gm.userid = ue.userid
JOIN mdl_enrol e ON ue.enrolid = e.id AND e.courseid = g.courseid
JOIN mdl_context co ON co.instanceid = e.courseid AND co.contextlevel = 50
JOIN mdl_role_assignments ra ON ra.userid = ue.userid AND ra.contextid = co.id
JOIN mdl_role r ON ra.roleid = r.id
GROUP BY ue.id
Forum posts
SELECT p1.id, d.forum, d.course, d.groupid, p1.discussion, p1.parent, p1.userid, p1.created, p1.modified, p1.subject, p1.message, p1.attachment, p1.totalscore, IFNULL(p2.userid, d.userid) as target
FROM mdl_forum_posts p1
LEFT JOIN mdl_forum_posts p2 ON p1.parent = p2.id
LEFT JOIN mdl_forum_discussions d ON p1.discussion = d.id
Step 2: Data Wrangling
Load the libraries, files and set up the time series on posts similar to process discussed in detail earlier.
library(ggplot2)
require(scales)
library(dplyr)
library(tidyr)
library(magrittr)
library(RColorBrewer)
library(GGally)
library(zoo)
library(igraph)
library(devtools)
require(indicoio)
library(tm)

setwd("/home/james/infiniter/data")
mdl_log = read.csv(file = "mdl_logstore_standard_log.csv", header = TRUE, sep = ",")
posts = read.csv(file = "mdl_forum_posts.csv", header = TRUE, sep = ",")
groups = read.csv(file = "mdl_groups_members.csv", header = TRUE, sep = ",")

### Create a POSIX time from timestamp
posts$time <- as.POSIXlt(posts$created, tz = "Australia/Sydney", origin="1970-01-01")
posts$day <- posts$time$mday
posts$month <- posts$time$mon+1 # month of year (zero-indexed)
posts$year <- posts$time$year+1900 # years since 1900
posts$hour <- posts$time$hour

posts$dts_str <- interaction(posts$day,posts$month,posts$year,sep='_')
posts$dts <- strptime(posts$dts_str, "%d_%m_%Y")
posts$dts <- as.POSIXct(posts$dts)
posts$week <- format(posts$dts, '%Y-%U')
I filtered users on a particular group within a course, however readers will need to adjust this accordingly using the group members extraction above (if you don’t use Moodle groups just use the course instead). The below code creates the filter variable users.
g <- tbl_df(groups)
users <- (g %>% filter(groupid == 1234))$userid
Forum posts
Create some simple text cleaning functions
# returns string without HTML tags. clean <- function(x) gsub("(<[^>]*>)", " ", x) # returns string with spaces instead of &nbsp; space <- function(x) gsub("&nbsp;", " ", x) # returns string w/o leading or trailing whitespace. trim <- function (x) gsub("^\\s+|\\s+$", "", x) # returns string w/o double-spaces. trim2 <- function (x) gsub("^ *|(?<= ) | *$", "", x, perl=T)
Process the forum post data. This essentially creates a data frame, tidies up time and userid variable types, counts the number of external links, tags whether the post is a reply, filters to the group under analysis, cleans the message of HTML, coded spaces, leading and trailing spaces, and extra whitespace, count the number of words, and finally determine whether the post was a reply to the teacher or a peer (based on hard-coded ids – this could be improved). Forum posts use simple HTML markup and structures so cleaning can be achieved with regular expressions – this would not work on all text.
f <- tbl_df(posts)
f %<>% mutate(time = as.POSIXct(time)) %>%
 mutate(userid = as.factor(userid)) %>%
 mutate(links = ifelse(gregexpr("<a href=", f$message)[[1]] == -1, 0,
 length(gregexpr("<a href=", f$message)[[1]]))) %>%
 mutate(reply = ifelse(parent>0, 1, 0)) %>%
 filter(groupid == 1234) %>%
 mutate(clean_message = clean(message)) %>%
 mutate(clean_message = space(clean_message)) %>%
 mutate(clean_message = trim(clean_message)) %>%
 mutate(clean_message = trim2(clean_message)) %>%
 mutate(wcount = sapply(gregexpr("\\S+", clean_message), length)) %>%
 mutate(to = ifelse(target %in% c(10603, 10547), 'Teacher', 'Peer'))
Then apply the sentiment analysis using Indico (you’ll need an API key).
f %<>% rowwise() %>% mutate(sentiment = sentiment(clean_message, api_key = 'xxxxx'))
f %<>% rowwise() %>% mutate(libertarian = political(clean_message, api_key = 'xxxxx')$Libertarian)
f %<>% rowwise() %>% mutate(liberal = political(clean_message, api_key = 'xxxxx')$Liberal)
f %<>% rowwise() %>% mutate(green = political(clean_message, api_key = 'xxxxx')$Green)
f %<>% rowwise() %>% mutate(conservative = political(clean_message, api_key = 'xxxxx')$Conservative)
Finally, set up the social network matrix using the igraph library.
n <- tbl_df(posts) %>% mutate(time = as.POSIXct(time))
n %<>% filter((userid %in% users) | (target %in% users)) %>%
  select(userid, target)

nmatrix <- as.matrix(n)
ngraph <- graph.data.frame(nmatrix)
adj.mat <- get.adjacency(ngraph,sparse=FALSE)
net=graph.adjacency(adj.mat,mode="directed",weighted=TRUE,diag=FALSE)
And establish the network metrics for centrality
metrics <- data.frame(
 deg=degree(net),
 bet=betweenness(net),
 clo=closeness(net),
 eig=evcent(net)$vector,
 cor=graph.coreness(net)
 )

metrics <- cbind(userid = rownames(metrics), metrics)
rownames(metrics) <- NULL
Step 3: Data Visualisation
Forum posts per week per student
ggplot(subset(f, !(userid %in% c(10603, 10547))), aes(x=dts)) +
 geom_line(aes(color=to), stat="bin", binwidth=7*24*60*60) +
 scale_x_datetime(breaks = date_breaks("4 week"),
 minor_breaks = date_breaks("1 week"),
 labels = date_format("%d-%b")) +
 scale_y_continuous(breaks = seq(0, 10, 5)) +
 coord_cartesian(ylim = c(0,10)) +
 xlab('Week') + ylab('Forum posts') +
 theme(axis.text.x = element_text(angle = 60, hjust = 1)) +
 facet_wrap(~userid, ncol = 7)
Forum words per post

fg <- group_by(f, userid, to) %>%
 summarise(wordspp = mean(wcount), medwords = median(as.numeric(wcount)),
 totalwords=sum(wcount), posts=n()) %>%
 filter(!(userid %in% c(10603, 10547)))

ggplot(fg, aes(userid, wordspp), group=to) +
 geom_bar(stat="identity", aes(fill=to), position="dodge") +
 geom_text(aes(label=posts), size=3, color="#2C3E50",
 position=position_dodge(width=0.9), vjust=0) +
 xlab('User (label = total posts)') + ylab('Words per post') +
 theme(axis.text.x = element_text(angle = 60, hjust = 1))
Social Network
V(net)$Role=as.character(g$role[match(V(net)$name,g$userid)])
V(net)$color=V(net)$Role
V(net)$color=gsub("coursedeveloper","#06799F",V(net)$color)
V(net)$color=gsub("editingteacher","#60B3CE",V(net)$color)
V(net)$color=gsub("student","#FF8300",V(net)$color)

V(net)$label.cex <- 2.2 * V(net)$degree / max(V(net)$degree)+ .2
V(net)$label.color <- rgb(0, 0, .2, .8)
V(net)$frame.color <- NA
egam <- (log(E(net)$weight)+.4) / max(log(E(net)$weight)+.4)
E(net)$color <- "#9E9E9E"
E(net)$width <- egam

tkplot(net, layout=layout.fruchterman.reingold, edge.width=0.25*E(net)$weight,
 edge.curved=TRUE)
Centrality
ggplot(metrics, aes(x=bet, y=eig, label=userid)) +
 geom_text(angle=30, size=3.5, alpha=0.8, color="#60b3ce") +
 labs(x="Betweenness centrality", y="Eigenvector centrality")
Sentiment
ggplot(f, aes(dts, sentiment)) +
 geom_rect(aes(xmin=strptime('2015-01-22',"%Y-%m-%d"),
 xmax=strptime('2015-05-10',"%Y-%m-%d"),
 ymin=0, ymax=0.5), fill="#FFB2B2", alpha=0.5) +
 geom_rect(aes(xmin=strptime('2015-01-22',"%Y-%m-%d"),
 xmax=strptime('2015-05-10',"%Y-%m-%d"),
 ymin=0.5, ymax=1), fill="#B2F0B2", alpha=0.5) +
 geom_point() +
 geom_line(stat = 'summary', fun.y = mean, linetype=2) +
 scale_x_datetime(breaks = date_breaks("1 week"),
 minor_breaks = date_breaks("1 day"),
 labels = date_format("%d-%b-%y")) +
 theme(axis.text.x = element_text(angle = 60, hjust = 1))
Political leaning
ggplot(f, aes(x=userid)) +
 geom_point(aes(y=libertarian, color="yellow")) +
 geom_point(aes(y=liberal, color="red")) +
 geom_point(aes(y=green, color="green")) +
 geom_point(aes(y=conservative, color="blue")) +
 scale_colour_manual(name = 'Political leaning',
 values =c('yellow'='yellow', 'red'='red',
 'green'='green','blue'='blue'),
 labels = c('Conservative', 'Green', 'Liberal', 'Libertarian')) +
 theme(axis.text.x = element_text(angle = 60, hjust = 1))
Libertarian Sentiment
ggplot(f, aes(x=libertarian, y=sentiment, label=userid)) +
 geom_point(angle=30, size=3.5, alpha=0.8, color="#60b3ce") +
 coord_cartesian(xlim = c(0, 1), ylim = c(0, 1)) +
 labs(x="Libertarian leaning", y="Sentiment")
Next task: assignment metrics
